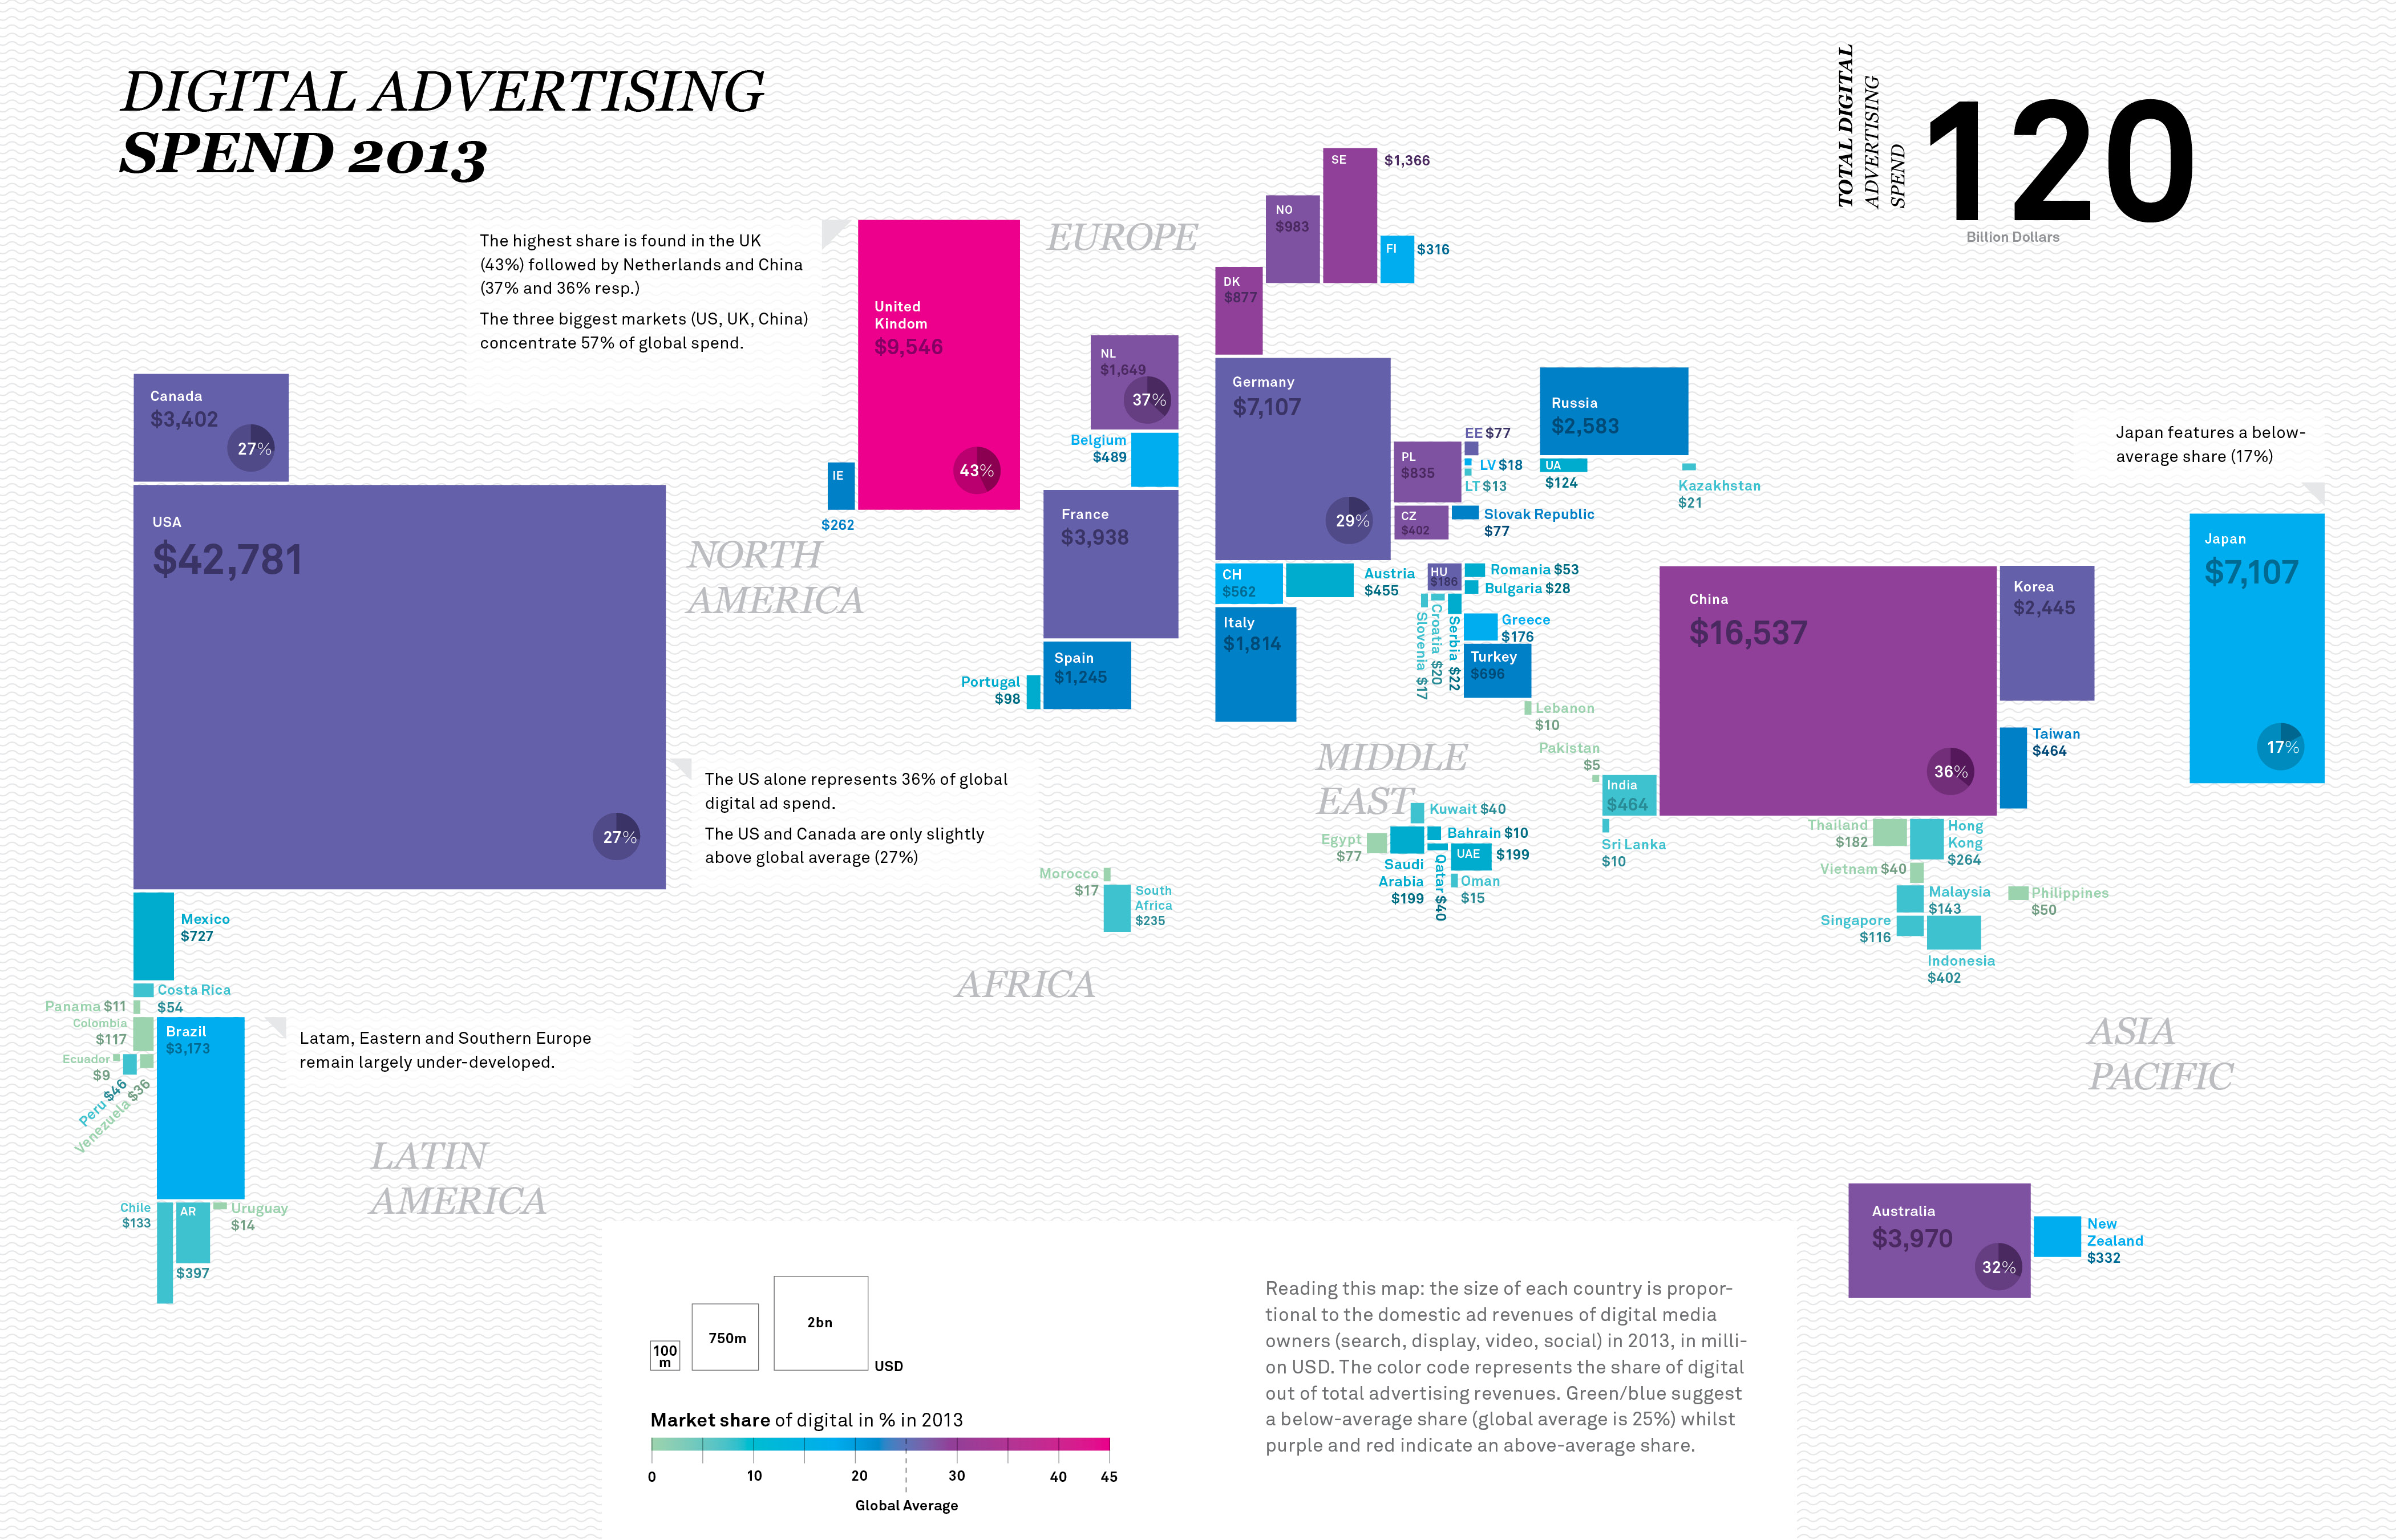
This map from MAGNA represents the global digital media market in two dimensions. The size of each country is proportional to its domestic digital ad revenues (including search, display, video, and social) in 2013. And the color code represents the maturity of the market (i.e. the share of total advertising spend going into digital media) around the global average of 24%. This visually informative infographic shows, for instance, that UK is number one in terms of maturity, with digital media controlling 43% of the advertizing market (USD 9.5bn), followed by Netherlands and China (37% and 35%, respectively). It also shows that despite taking up 36% of global spending in digital ad., the US is only slightly above global average with a maturity level of 27%.
Note: the infographic featured here is an updated version of a similar one the Lab published over a month ago.

