By The Numbers: Mobile Purchase Habits

As mobile usage continues to rise, mobile spending is correspondingly increasing, growing 42% annually over a four-year period. Therefore, it is important for brands looking to conquer the mobile space to understand how and when average users are making purchases on mobile devices and hopefully discover some behavioral patterns that can help inform brands’ mobile commerce strategy.

1- Applovin_RevenuebyHour

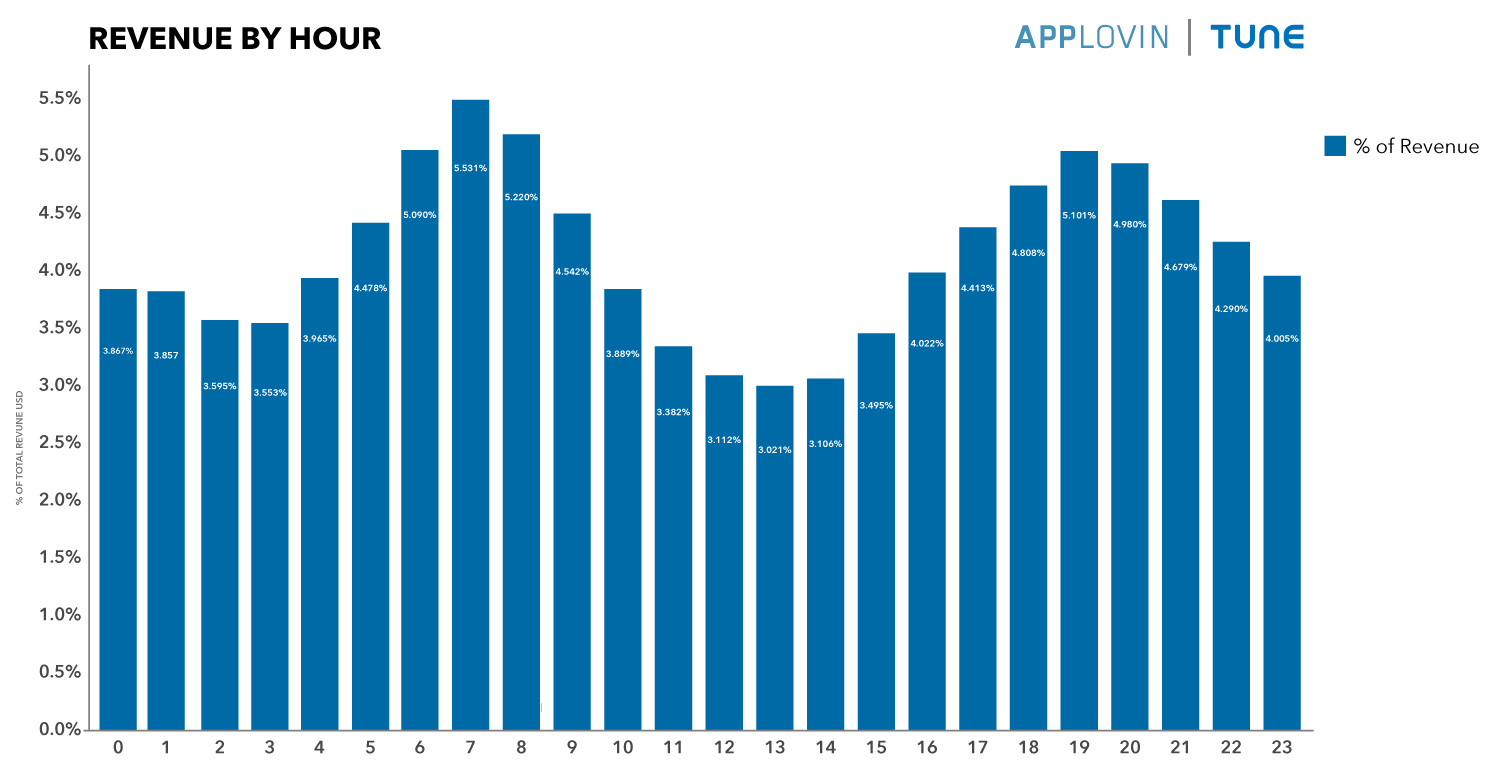
Whether in games, retail, travel or other commerce apps, users are much more likely to make purchases before and after work, according to a study from AppLovin and TUNE. The study found that, on an hourly basis, mobile revenues and usage spikes to a daily high around both 7 a.m. and 7 p.m. during weekdays, discrediting the myth of “lunch break shopping”.

2 -Applovin_RevenuebyWeekdayjpg

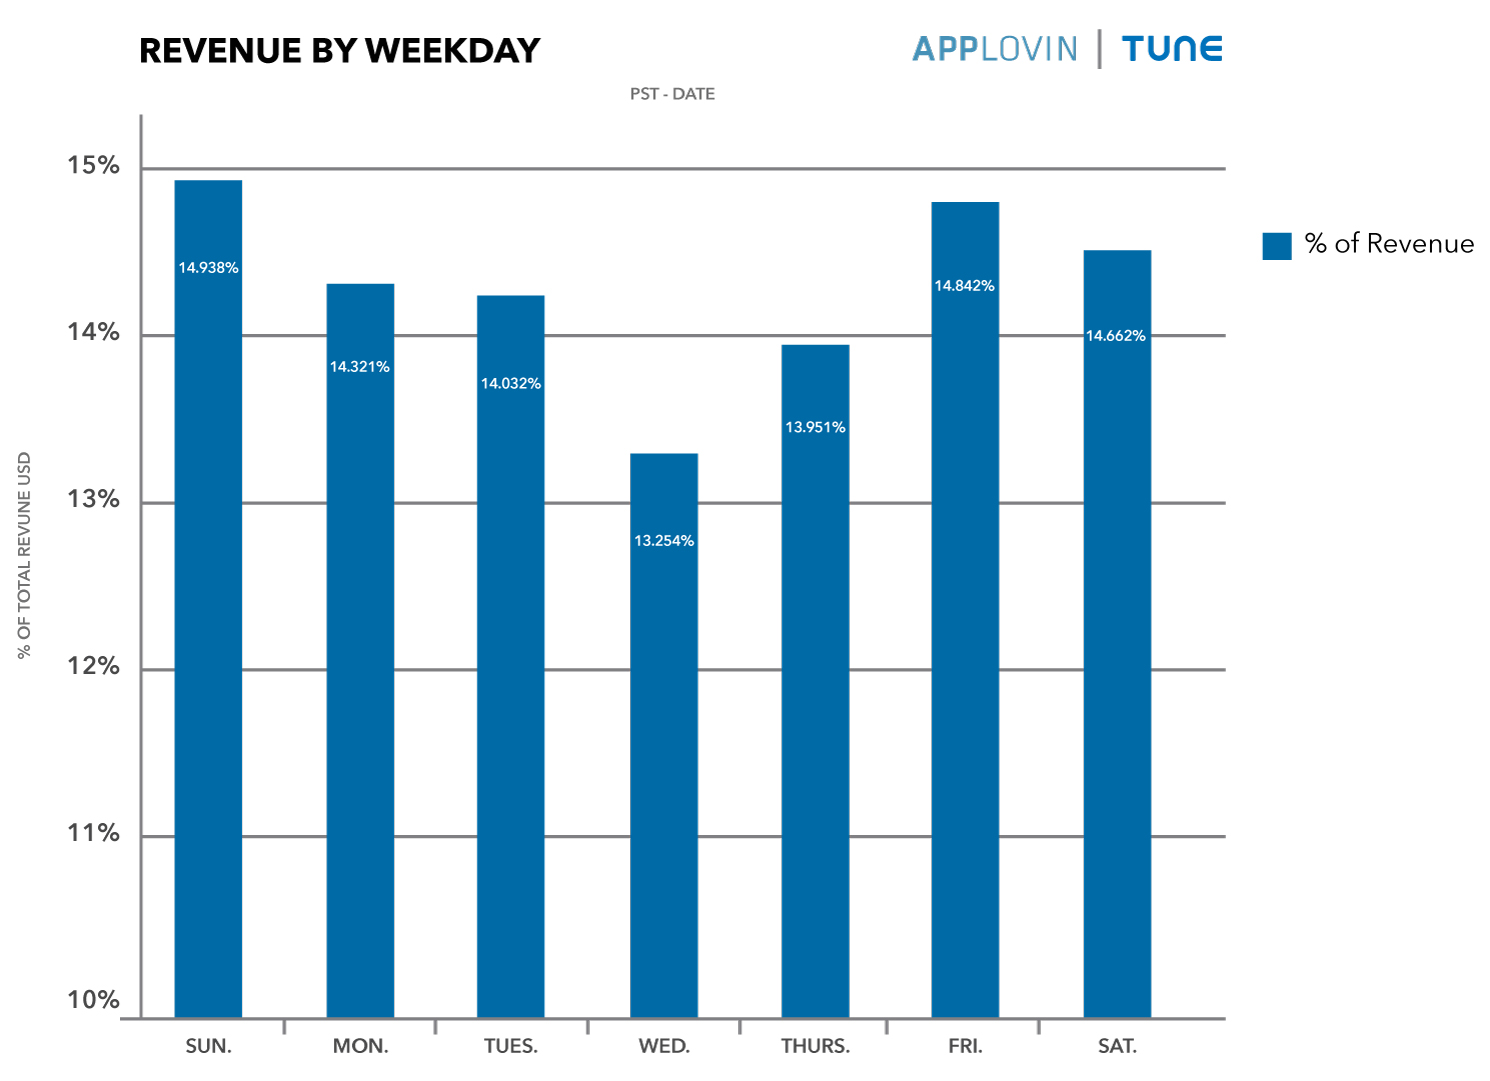
Similarly, on a day-to-day basis, mobile spending peaks over weekends, while Wednesday marks the lowest. Although it is generally established that Mondays are generally the best revenue for online retail, Fridays and Sundays take the top spots for most in-app purchasing and spending.

3- Applovin_UsagebyWeekday


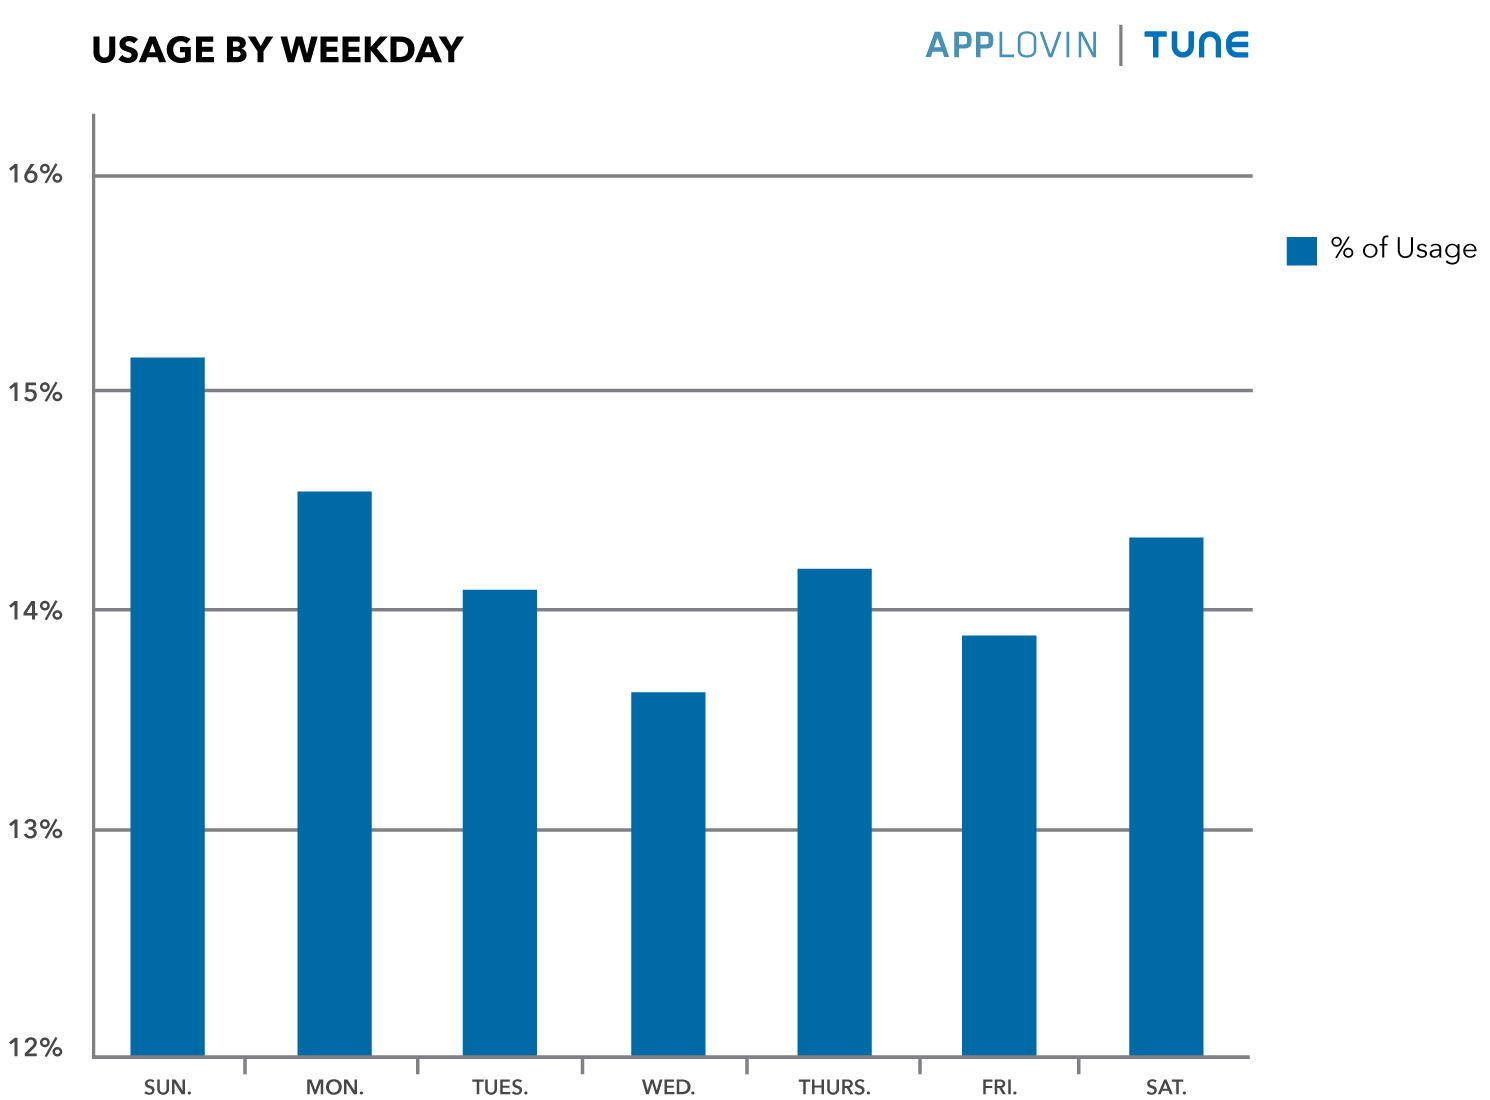
It is also important to note that mobile spending revenue pattern doesn’t necessarily correlate to mobile usage. While Wednesdays, the lowest day in terms of revenue, do register the lowest mobile usage of the week, Friday, second slowest day in terms of usage, is also the second highest in terms of revenue.

4 - Applovin_UsagebyHour

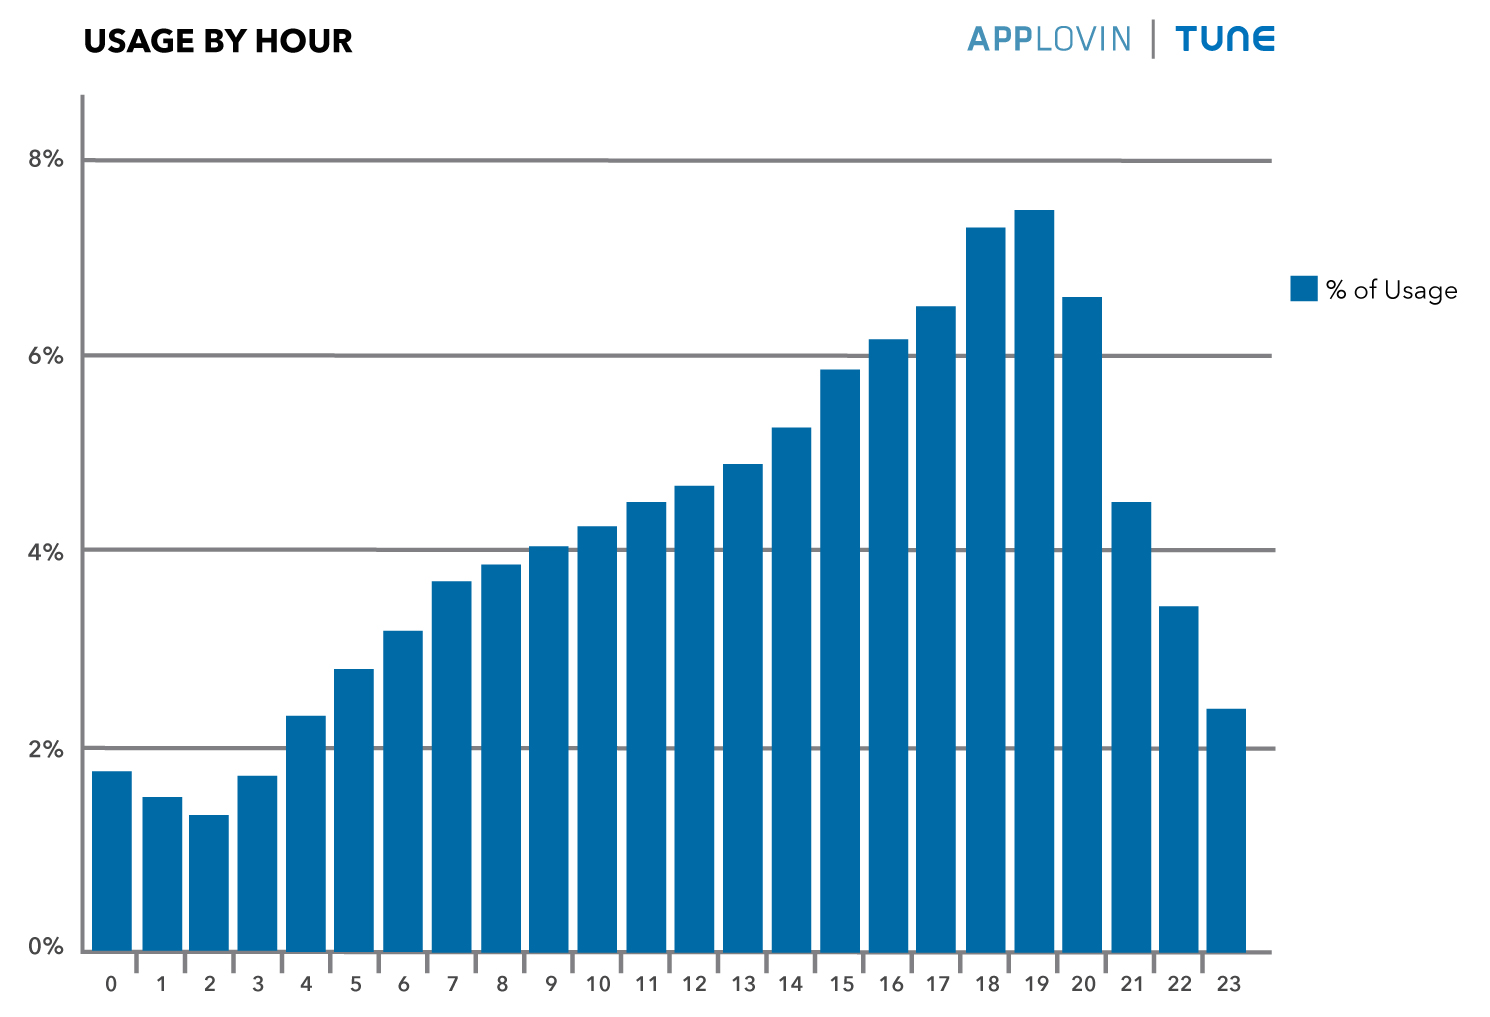
Likewise, on an hourly basis, evening is when usage and spending both hit their daily peaks, whereas the morning hours post similar spending but less usage. The bottom line here is mobile commerce is not the same as general ecommerce, and marketers need to find ways to programmatically increase win rates during peak hours and weekends that fit the mobile spending patterns.

All featured charts courtesy of AppLovin Blog.


Amazon Incentivizes Developers With In-App Rev Share

Amazon is luring developers to their platform with a clever Amazon.com tie-in. Developers who choose to integrate Amazon purchasing into their apps via a linked Amazon account will earn up to 6% of purchases. The deal seems like a win-win as Amazon supports their dotcom and app ecosystem while developers gain another revenue stream. With that said, the Kindle series holds a slim 4% market share in the tablet space and will need to have a lot of developers buy-in if they want to have success over the next year or so. 

In-App Purchase Revenue Hits Record High

Last January, 53% of all iPhone App Store revenue in the U.S. was generated through in-app purchases (IAP); this month though, that number has reached a whopping 76%. By region, the numbers tell a slightly different story: in Germany it’s only 61%, but in Asia, at least 90% of all Apple app-store revenue is derived from in-app purchases. In the United States, 71% of these in-app purchases came from apps that were free to download but contained virtual goods within them, indicating that putting a price tag on an app is even more of a hinderance to getting curious users to install an app when there are over 800,000 iOS apps to choose from. Even more telling is that the average revenue per app downloaded, even amidst free apps, was $0.99, the base price for all apps. Indeed, the top grossing apps from February 2013 were all “freemium,” indicating that the market share of IAP, particularly free apps, is booming, and that freemium apps are pushing the conventional app business model out of the spotlight.